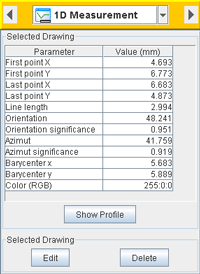
1D Measurement |
 |
This tool allows creating lines to measure an element in the image
or to build a profile of the pixel intensities of the current image. If
there is no spatial calibration,
the segment length value is displayed in pixels.

In the toolbar above, the first toggle button (the one after the hand)
allows selecting or moving drawings, the three next ones allows creating
new lines: segment, polyline and freehand line. The two arrow buttons
allow going from one segment to another. The last button will delete the
selected drawings.

|
The
Show Profile button opens the profile of the
pixel intensities of the current image. The min
and max values (yellow horizontal lines on the
plot) limit the range of the pixel intensities shown in the Statistics
and Data tables. In the Statistics
table, the Threshold ratio gives the ratio between
all the line pixels and the number of the pixels which have intensities
in the limited range. The selected table can be saved in CSV
format.
 Note:
When moving or resizing a line, or when the image is changed,
the profile is automatically actualized. Note:
When moving or resizing a line, or when the image is changed,
the profile is automatically actualized.
 Note:
When moving along the profile plot, a pointer shows the corresponding
position on the image and pixel
information appears in the status bar. Note:
When moving along the profile plot, a pointer shows the corresponding
position on the image and pixel
information appears in the status bar.
|
1D Measurement Descriptors
Position:
- First point X: X coordinate position
(image) of the first point of the line.
- First point Y: Y coordinate position
(image) of the first point of the line.
- Last point X: X coordinate position
(image) of the last point of the line.
- Last point Y: Y coordinate position
(image) of the last point of the line.
- Barycenter x: X coordinate position (image) of
the center of gravity of the line.
- Barycenter y: Y coordinate position (image) of
the center of gravity of the line.
 Note: The image
position (0,0) is located by default in the upper left corner
  . However, the origin and
the direction of the y axis can be modified in the Spatial
Calibration tool.
Basic:
- Line length: Length of the line.
- Orientation: Angle between the horizontal axis
and the line (0-180 degrees, counterclockwise).

- Orientation significance: Define the significance
(0 to 1) of the orientation according to the line shape. A straight
line has the value 1. Conversely, a tortuous line will have a lower
value.
- Azimuth: Horizontal angular distance from the
northern point (at the top). The measurement is made clockwise through
360° by placing the center of the circle on the first point of the
line.

- Azimuth significance: The ratio between the line
length and the Euclidian distance between the first and the last point
defines the significance (0 to 1) of the azimuth. A straight line
has the value 1.
- Color (RGB): Color of the line, defined by the
red, green and blue components.
1D Measurement preferences
Only the checked parameters will appear in the Selected Drawing
panel and in the Data
Viewer.
 Note: To display
the preferences, open the Project
Preferences window
  and select 1D measurement.
![]()
![]() Note: The image
position (0,0) is located by default in the upper left corner
Note: The image
position (0,0) is located by default in the upper left corner ![]() . However, the origin and
the direction of the y axis can be modified in the Spatial
Calibration tool.
. However, the origin and
the direction of the y axis can be modified in the Spatial
Calibration tool. 
![]() Note: To display
the preferences, open the Project
Preferences window
Note: To display
the preferences, open the Project
Preferences window ![]() and select 1D measurement.
and select 1D measurement.