Data Viewer |
The Data Viewer ![]() can display
the data produced by the Tools
and export them.
can display
the data produced by the Tools
and export them.
![]() Note: Only vector
drawings which are visible on the image (see Display)
are loaded in the Data Viewer. In addition, only the parameters that have
been checked in the preferences are visible.
Note: Only vector
drawings which are visible on the image (see Display)
are loaded in the Data Viewer. In addition, only the parameters that have
been checked in the preferences are visible.
![]() Note: For sorting
a column, click on the column header. A triangle indicates whether data
are sorted ascending or descending. There are three states: unsorted and
sorted ascending or descending. Use Ctrl + left click for sorting more
than one column.
Note: For sorting
a column, click on the column header. A triangle indicates whether data
are sorted ascending or descending. There are three states: unsorted and
sorted ascending or descending. Use Ctrl + left click for sorting more
than one column.
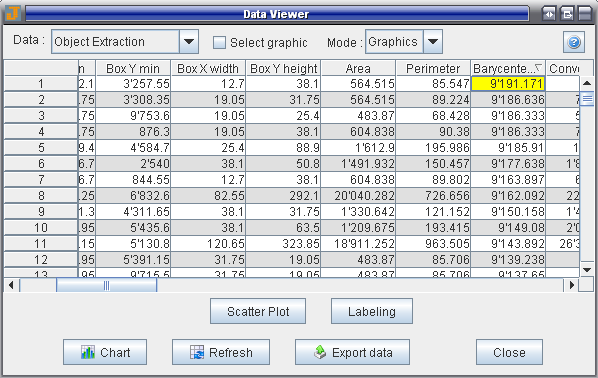
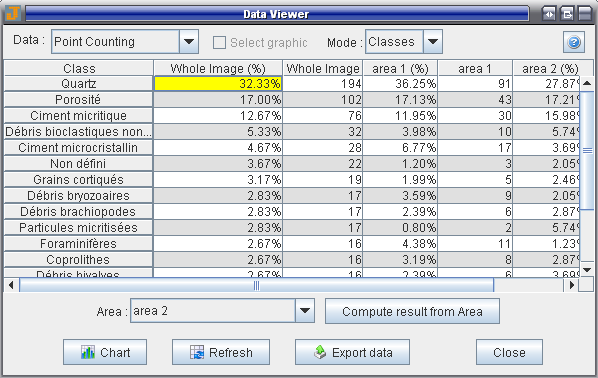
Data: Select a tool from the list.
Select graphic: When this box is checked and a cell of the table is selected, the corresponding drawing is selected and displayed in the center of the main window.
Mode: Graphics or Classes (see below).
Refresh: Reload the data (e.g. when drawings have been deleted or hidden).
Export Data: Export data in a semicolon separator file (.csv), in an ASCII tabulation separator file (.txt) or in an XML version 1.0 file (.xml).
![]() Note: When exporting
data, the complete decimal fraction of values is written.
Note: When exporting
data, the complete decimal fraction of values is written.
Shows the visible parameters of vector drawings of Note, 1D Measurement, 2D Measurement, Object Extraction, Point Counting and Image Factory (markers).

Chart: Shows the histogram of parameters.
Scatter Plot: Allows comparing values of two parameters.
Labeling: Allows applying a label on drawings (see Labeling).
Shows the surface percentages and the number of occurrences of the Object Extraction, Point Counting or Background classes.

Chart: Shows the pie chart of classes.
Compute result from Area: Allows computing the amount of classes in a specific area of the image (see Area Editor).
![]() Note: Only the
whole image area is automatically computed. The other areas must be computed
every time data are reloaded.
Note: Only the
whole image area is automatically computed. The other areas must be computed
every time data are reloaded.